
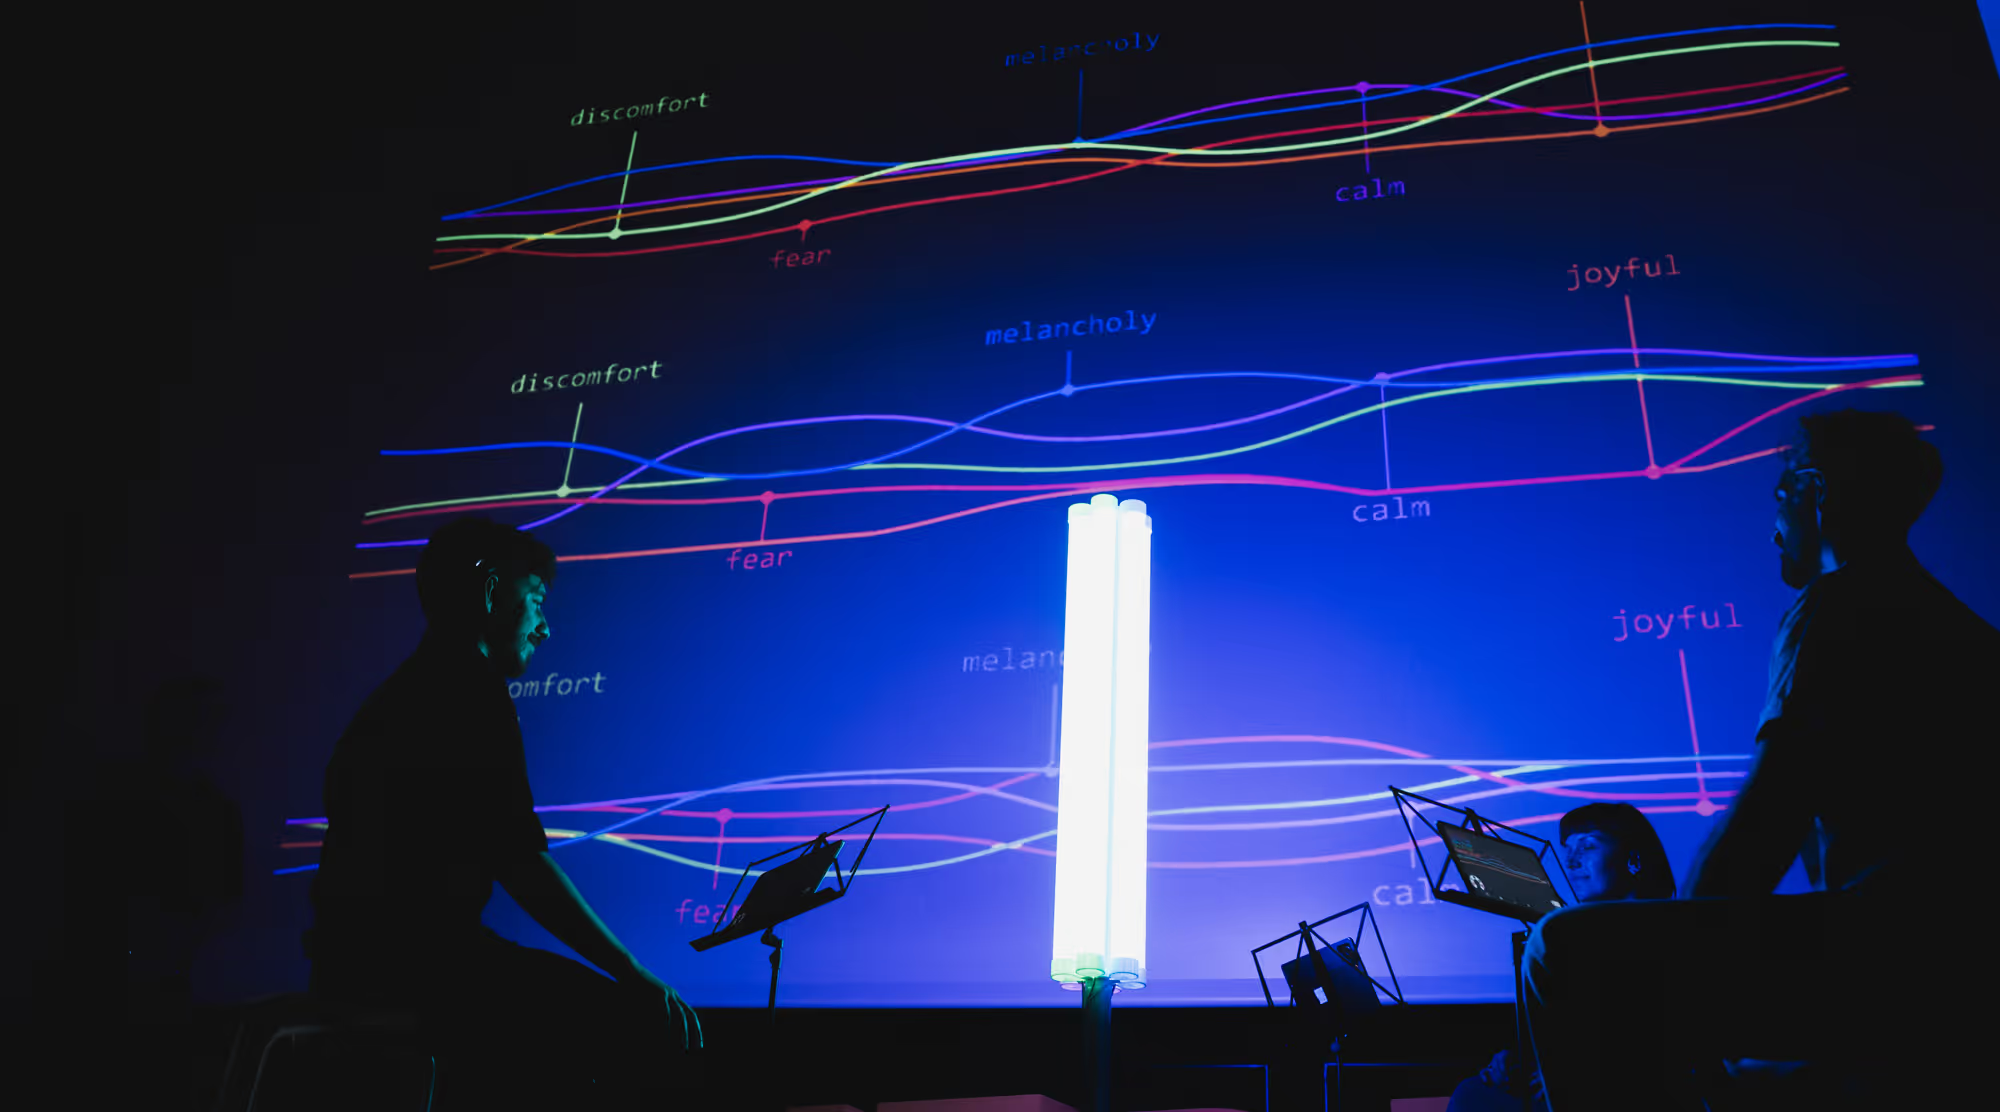
We are used to seeing data in charts and tables. Data sonification turns those same values into sound, making it possible to hear patterns in the data.
Imagine a year of temperature readings played as a sequence of notes. Give warmer days higher notes, and you can hear warm and cool periods as the pitch rises and falls. This connection between a value and a sound is called a mapping.
Choosing the mapping is part of the design. The same temperatures could change the tempo instead of the pitch.
A series of events can become a rhythm, while a change in volume can make a larger value stand out. Different sounds can help listeners distinguish between datasets played together.
Sonification does not have to be music. A simple tone can track a measurement, while an installation might weave those same relationships into a composed soundscape.
The pace can change, too: a year of readings can be heard in a few minutes. A live sonification, by contrast, responds as new measurements arrive.
At KLING KLANG KLONG, we develop the mapping and the sound together. Our starting point is what listeners can learn from the data, and we test the result for the way it will be heard.
1. Decide what listeners should notice
What do we want listeners to discover?
A gradual change over many years needs a different approach from a sudden shift. When comparing datasets, we decide which differences listeners should be able to hear.
That helps us choose which values to use.
2. Understand and select the data
Before using a dataset, we check its source and the level of detail it contains. Missing readings or uneven sampling affect what it can tell us.
Not every value needs a sound. Focusing on a few relevant relationships can make the result easier to follow.
3. Design the mapping
Next, we decide how those values will change the sound.
Possible choices include:
We listen back to check whether the intended changes are easy to notice. A mapping can follow the numbers exactly and still be difficult to understand.
4. Decide how the work will unfold
Some projects need a composed piece with a set beginning and end. Others call for a system that keeps generating sound from the data.
A live feed can let an installation respond to its surroundings. Visitor movement can become another input, changing the sound as people move through the space.
5. Test the playback
We test the sonification through the headphones or loudspeakers it is intended for, checking whether the changes in the data remain easy to hear.
For exhibitions and installations, we also listen in the space and along the visitor route. Room acoustics and neighbouring exhibits can affect which details come through, as can the time visitors spend listening.
In exhibitions and installations, sonification can be part of sound scenography. The focus then extends beyond the data: how will the sound work in the room, and how will it relate to the exhibits around it?
A visual can help explain a sound, but a nearby film can also pull attention away from it. Designing the media together makes it easier for visitors to follow the sonification.
In our projects, the source material ranges from climate records to computer simulations.
This installation turns AI analyses of political speeches into sound and light, allowing visitors to compare how the system interprets each speech. Its readings of language and emotion are interpretations, not objective measures of what a speaker feels.
Historical climate data reshapes Vivaldi's Four Seasons in this orchestral project. We developed the sound concept and used algorithms to edit the score, making environmental change audible within a familiar piece of music.
A four-hour multichannel soundscape brings a year of environmental change into the museum's underwater tunnel. It draws on measurements taken near the marine research station in Kerteminde in 2016.
Animal migration records guide an evolving composition for THE HERDS. A custom sound engine combines these records with weather and ecological data to shape the music as it plays.
In this audiovisual installation, data from a real-time river simulation shapes an evolving musical composition. The music system uses machine learning and draws on piano improvisations recorded in response to the simulated river movements.
A simulated school of fish reacts to visitors' movements. The sound follows its behaviour as the fish shift from swimming together to scattering in panic.
For a closer look at how we work with data as material for art, read Thoughts on the Poetry of Data and The Symphony of Our World.
What is data sonification?
Data sonification turns data into sound. Values can change the pitch of a note or the pace of a rhythm, making patterns audible.
Why use sound for data?
Sound can help us notice a recurring pattern or follow a change over time. Alongside a chart, it offers another way to explore the same information.
Where is data sonification used?
Sonification can communicate research and bring data into exhibitions, artworks and public spaces. It can also give audible feedback in an interface or help people explore environmental change.
Is data sonification always musical?
No. A tone that changes with a measurement is enough. Sonification can also be part of music or a soundscape, depending on what the work needs to communicate.
How does data sonification relate to sound scenography?
Data sonification turns data into sound. In an exhibition or installation, that sound can be one element of sound scenography, which shapes the wider listening experience in space and over time.
Thinking about sonification for a project?
Tell us about the idea and the data behind it. We can help develop the sound and bring it into your exhibition or installation.
